How to Use Rating Scale Slides on AhaSlides
How do Rating Scale Slides Work?
- The host poses a broad question, offers specific statements to that question, and asks the audience to rate their opinions on those specific statements on a sliding scale.
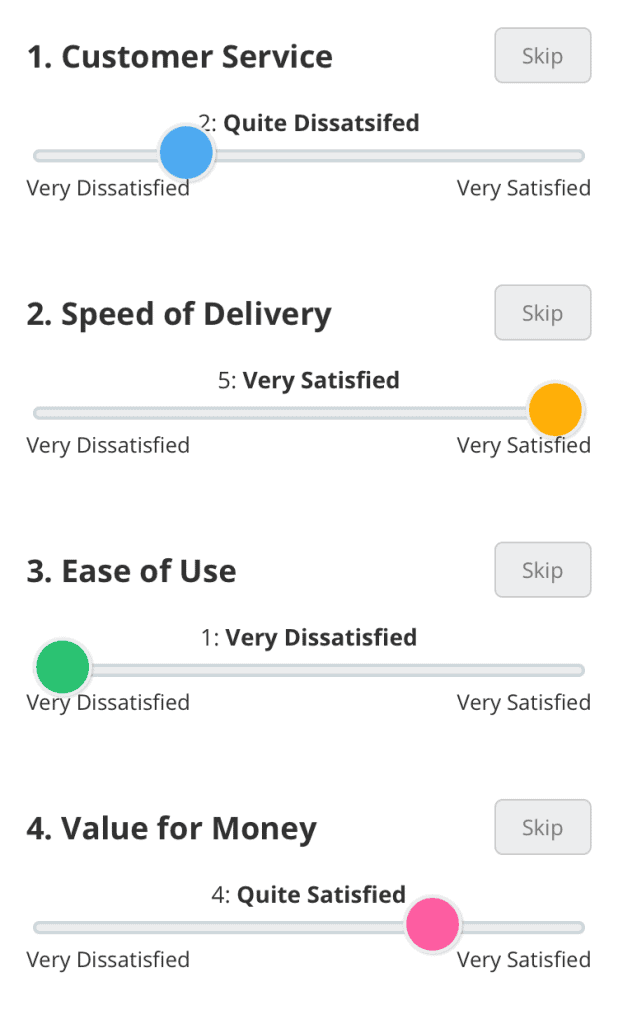
- The audience accesses the slide on their phones and responds to each of the statements via a sliding scale.
- The resulting data is shown on a graph that reveals what and how many responses each statement received. It also shows the average numbered response for each statement.
Setting up a Rating Scale Slide
#1 – Your Question
If you feel like your statement needs clarifying, you can also choose to ‘add a longer description’. The description will be shown underneath the question on audience members’ devices.
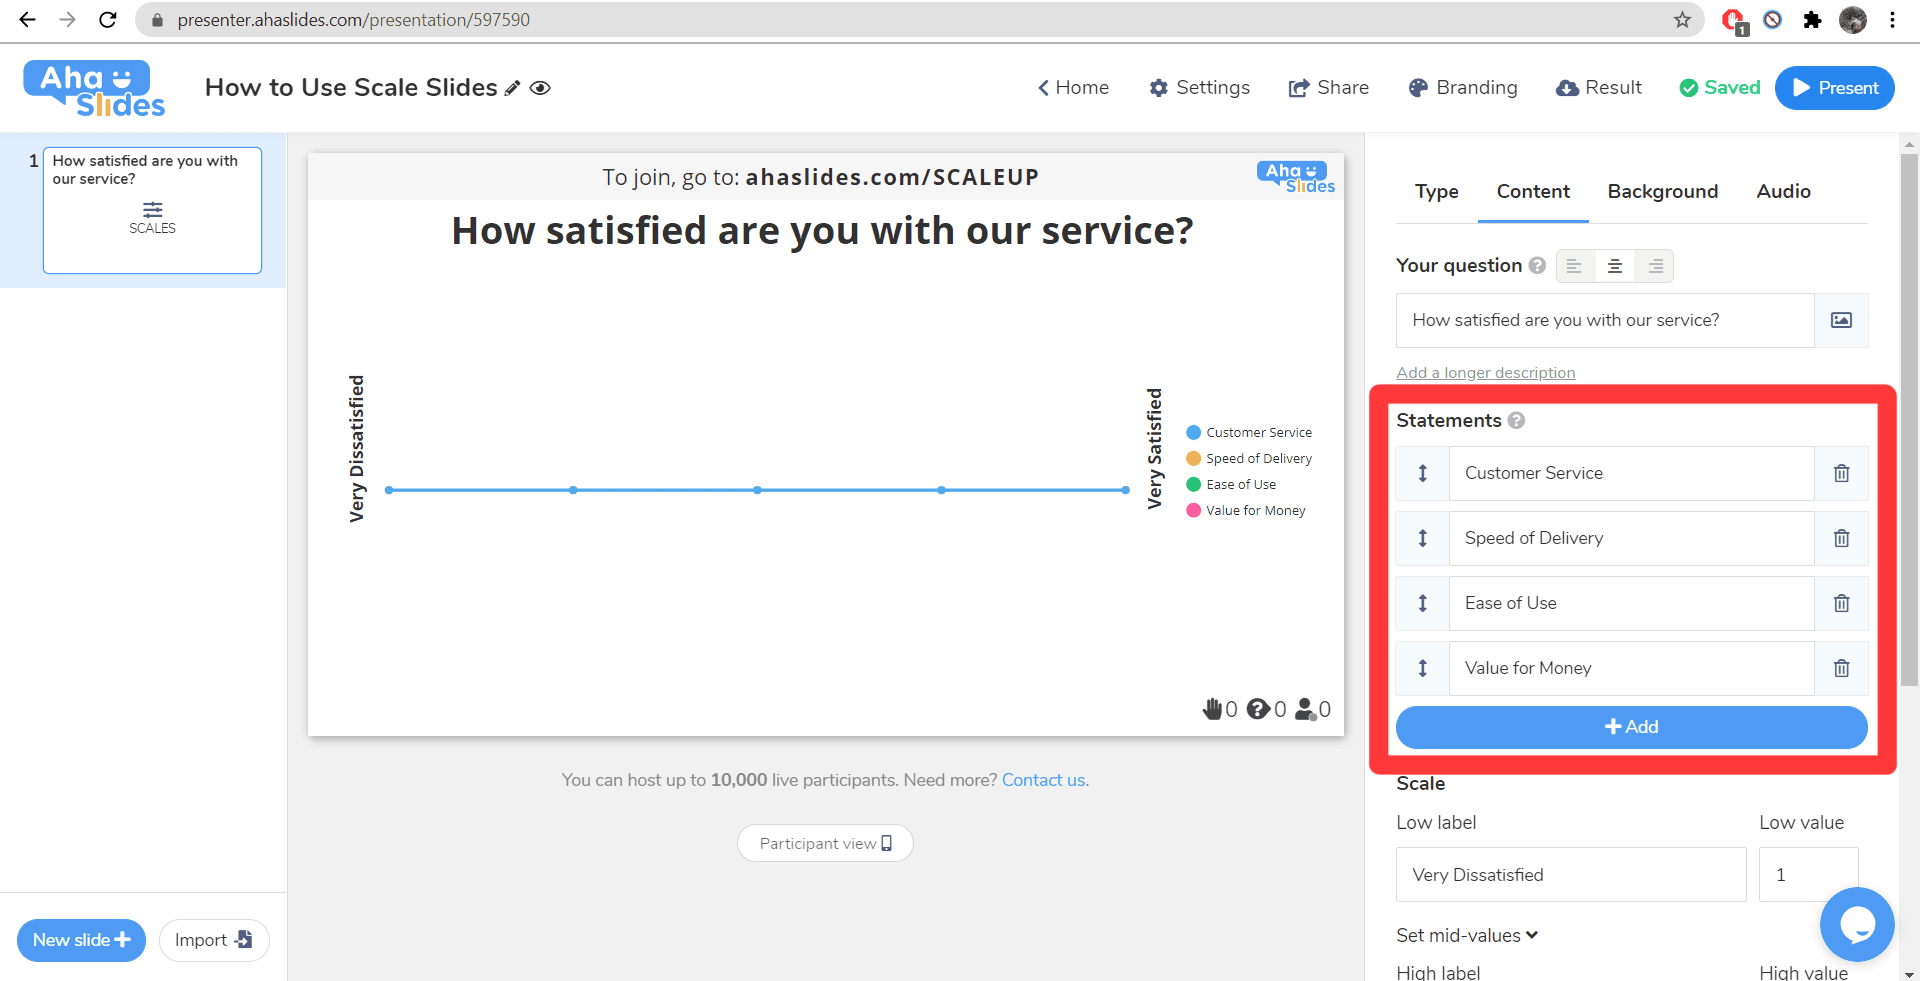
#2 – Statements
‘Statements’ are the specific parts of a broad question that you want an answer to.
For example, if you ask the broad question ‘how satisfied are you with our service?’, you might want responses to specific parts of the service that your audience were either satisfied or dissatisfied about. In this case, you can add up to 8 statements for different aspects of service, such as ‘ease of use’, ‘friendliness of staff’, ‘speed of delivery' etc.
Note: If your broad question is your statement, and you don’t require the statement field at all, you can delete all statement boxes. This centralises the layout and means that your audience will only respond to the one question at the top.
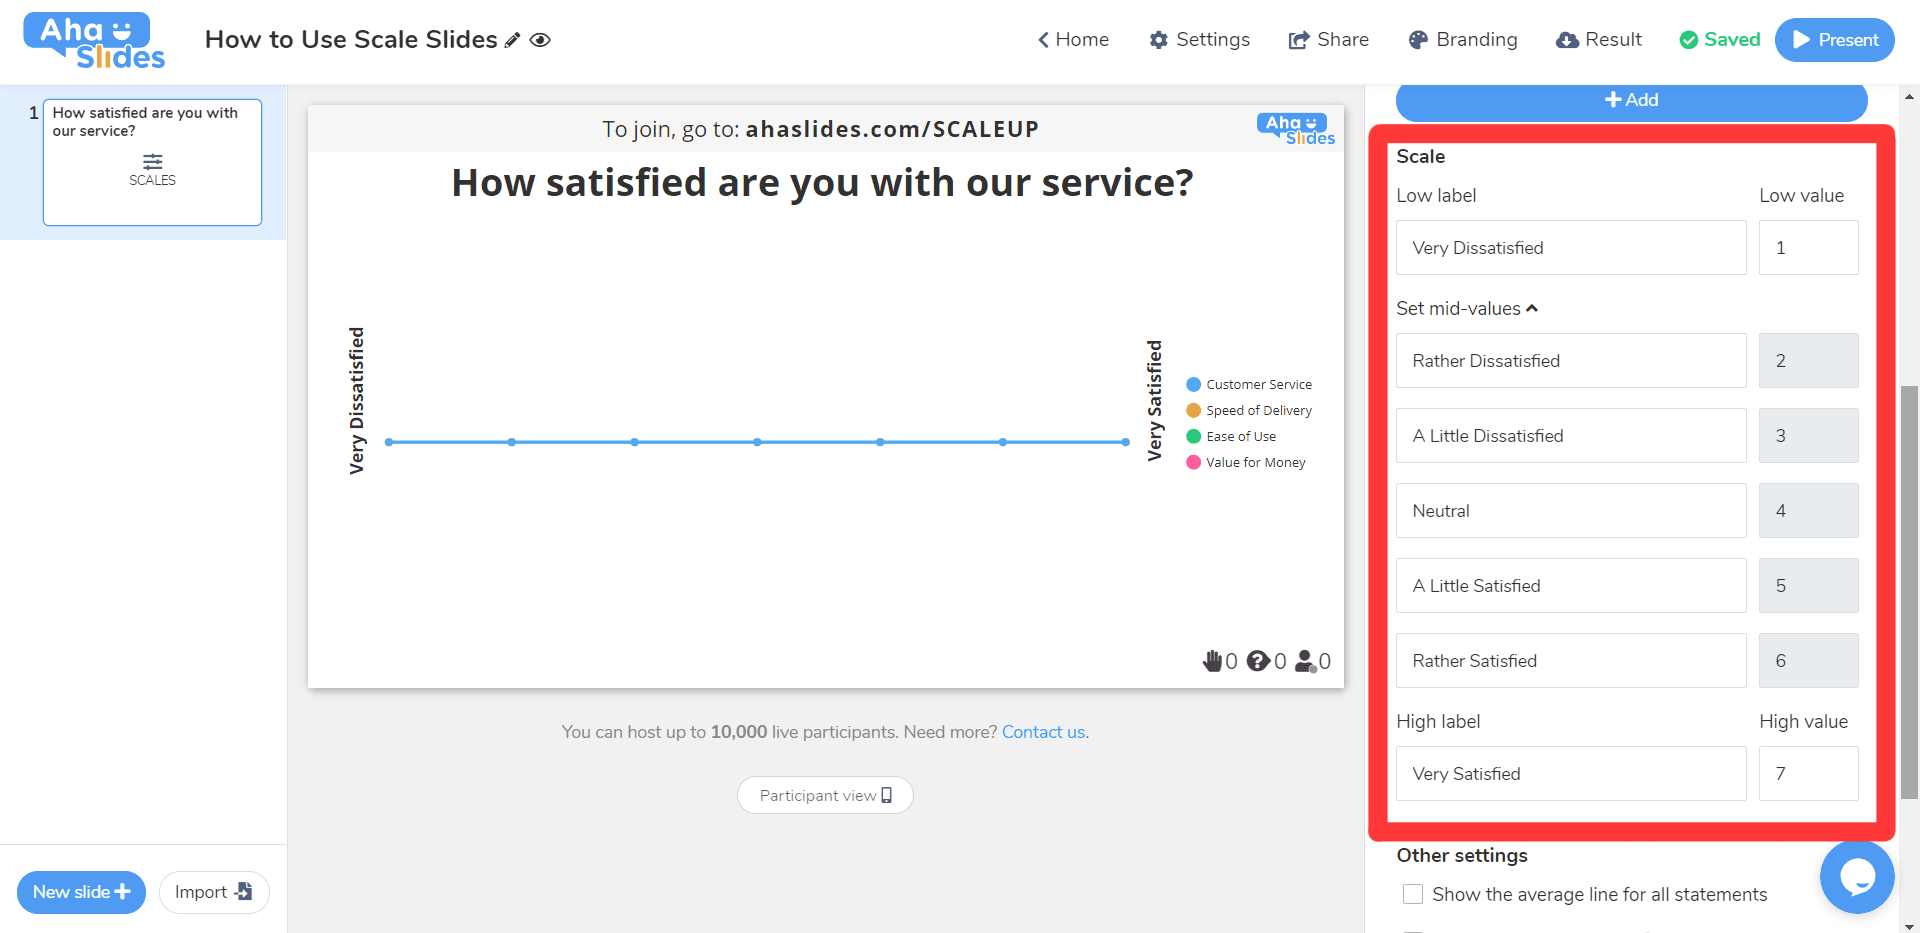
#3 – Scale
The ‘scale’ section deals with the wording and number of your scale’s values.
These values are typically from 1 to 5. In our ‘how satisfied are you with our service?’ example, 1 represents very dissatisfied and 5 represents very satisfied. You can attach specific wording to all values in between the two extremes to help your audience make a more informed and accurate decision on their opinions. The wording for the values will not appear on your desktop display, but they will appear on your audience’s devices (providing that the difference between the lowest value and highest value is not more than 10).
The standard rating scale slide on AhaSlides comes with 5 values, but you can increase this to any number you want (below 1000) if you want a more refined answer.
The low label and the high label are the lowest and highest values respectively, both of which will appear at either end of the scale on your display.
#4 – Time limit:
#5 – Close submission:
#6 – Hide results:
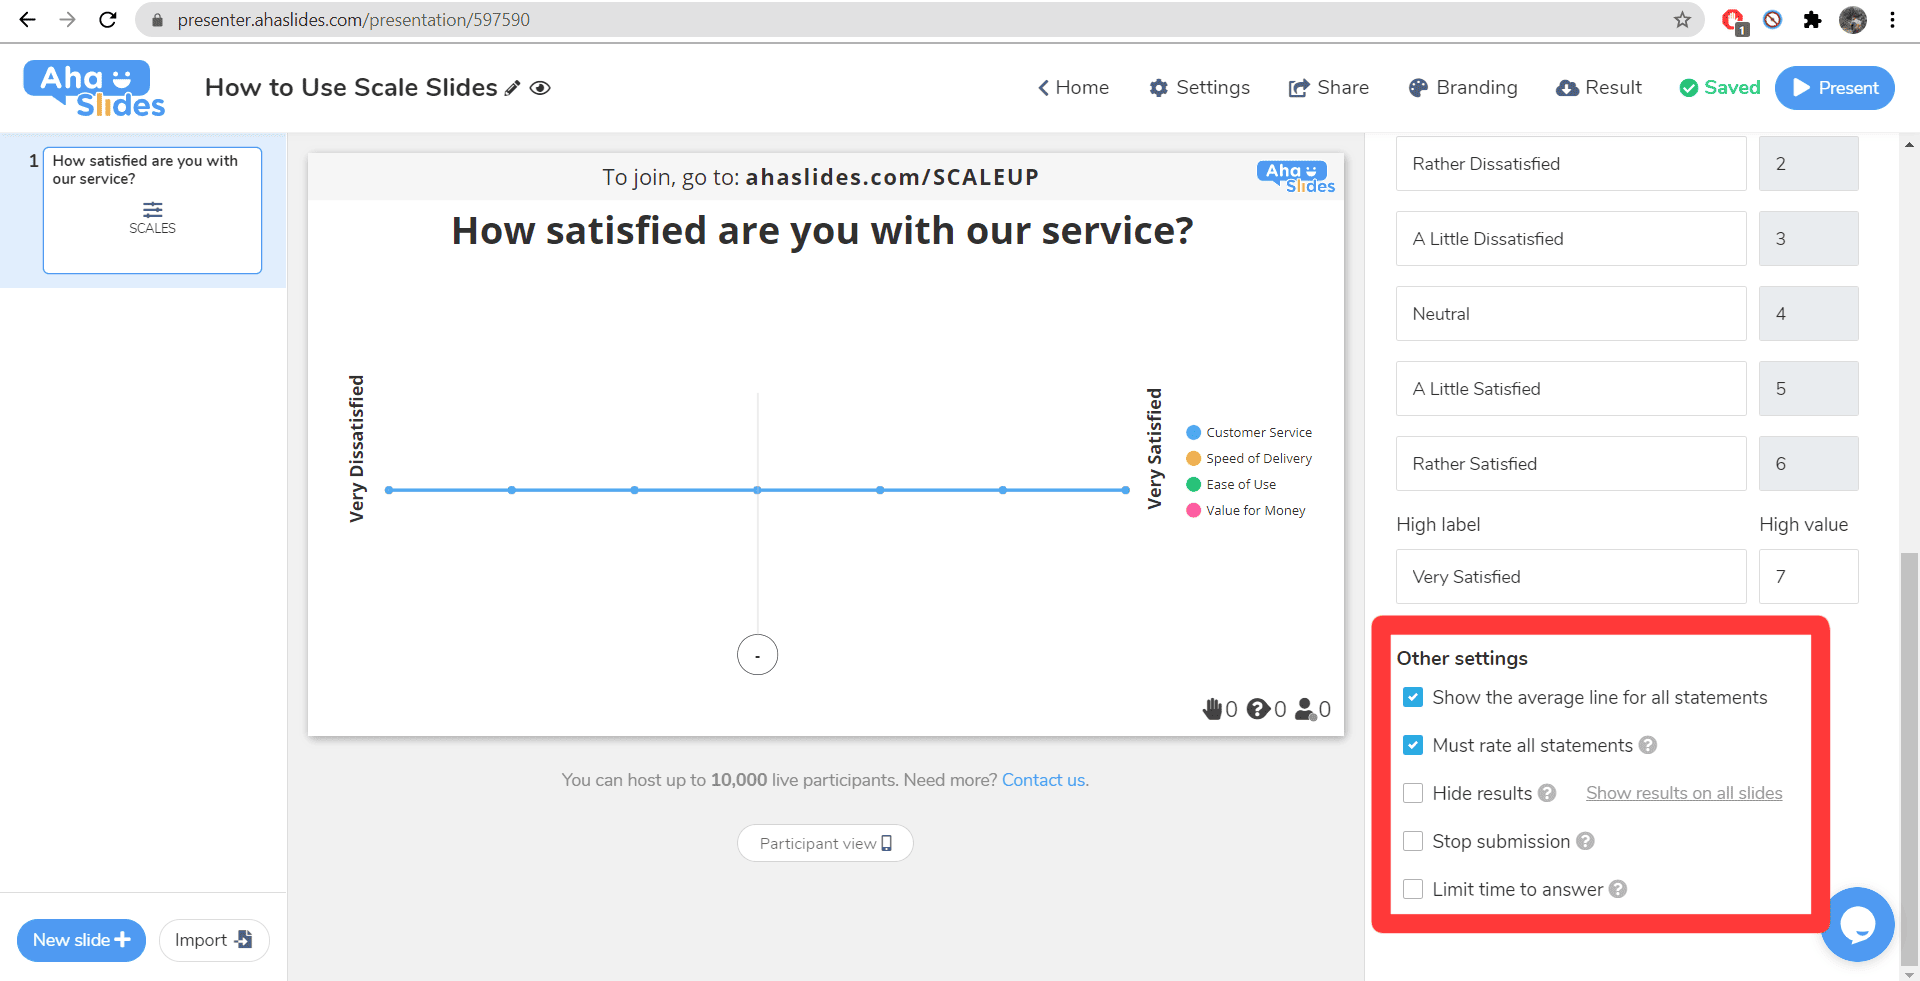
#7 – Other Settings
There are 2 ‘other settings’ on an AhaSlides scale slide that you can choose to check on or off:
- Show the average line for all statements: Displays a vertical line that reveals the average response number across all statements of your broad question.
- Must rate all statements: Removes the ‘skip’ option for statements and makes it mandatory to rate every statement.
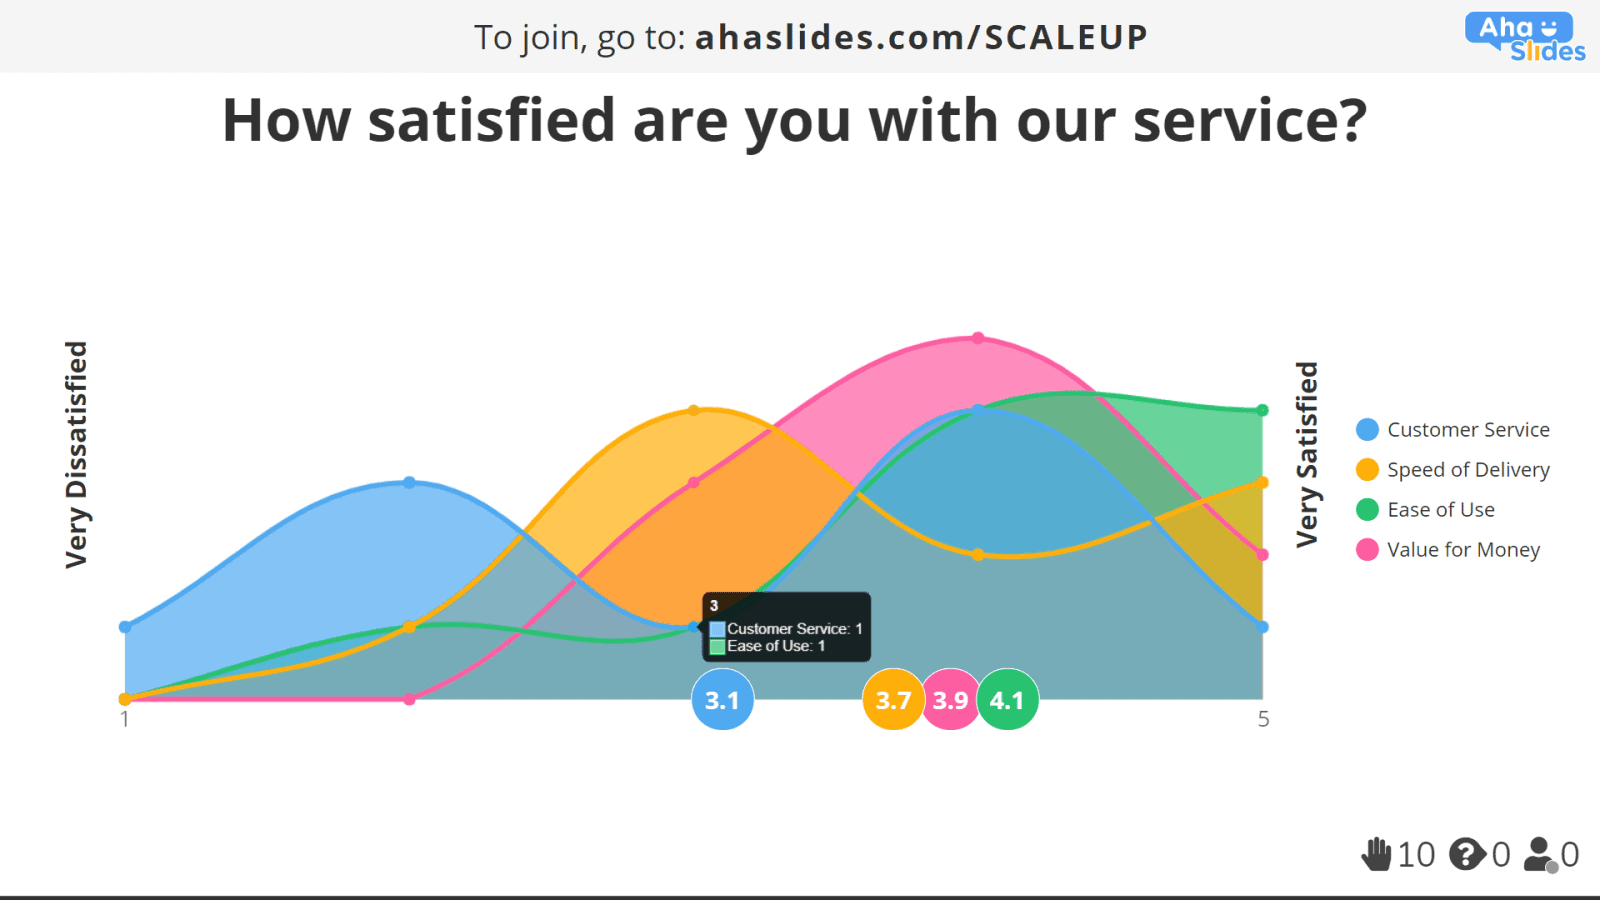
Understanding your Response Data
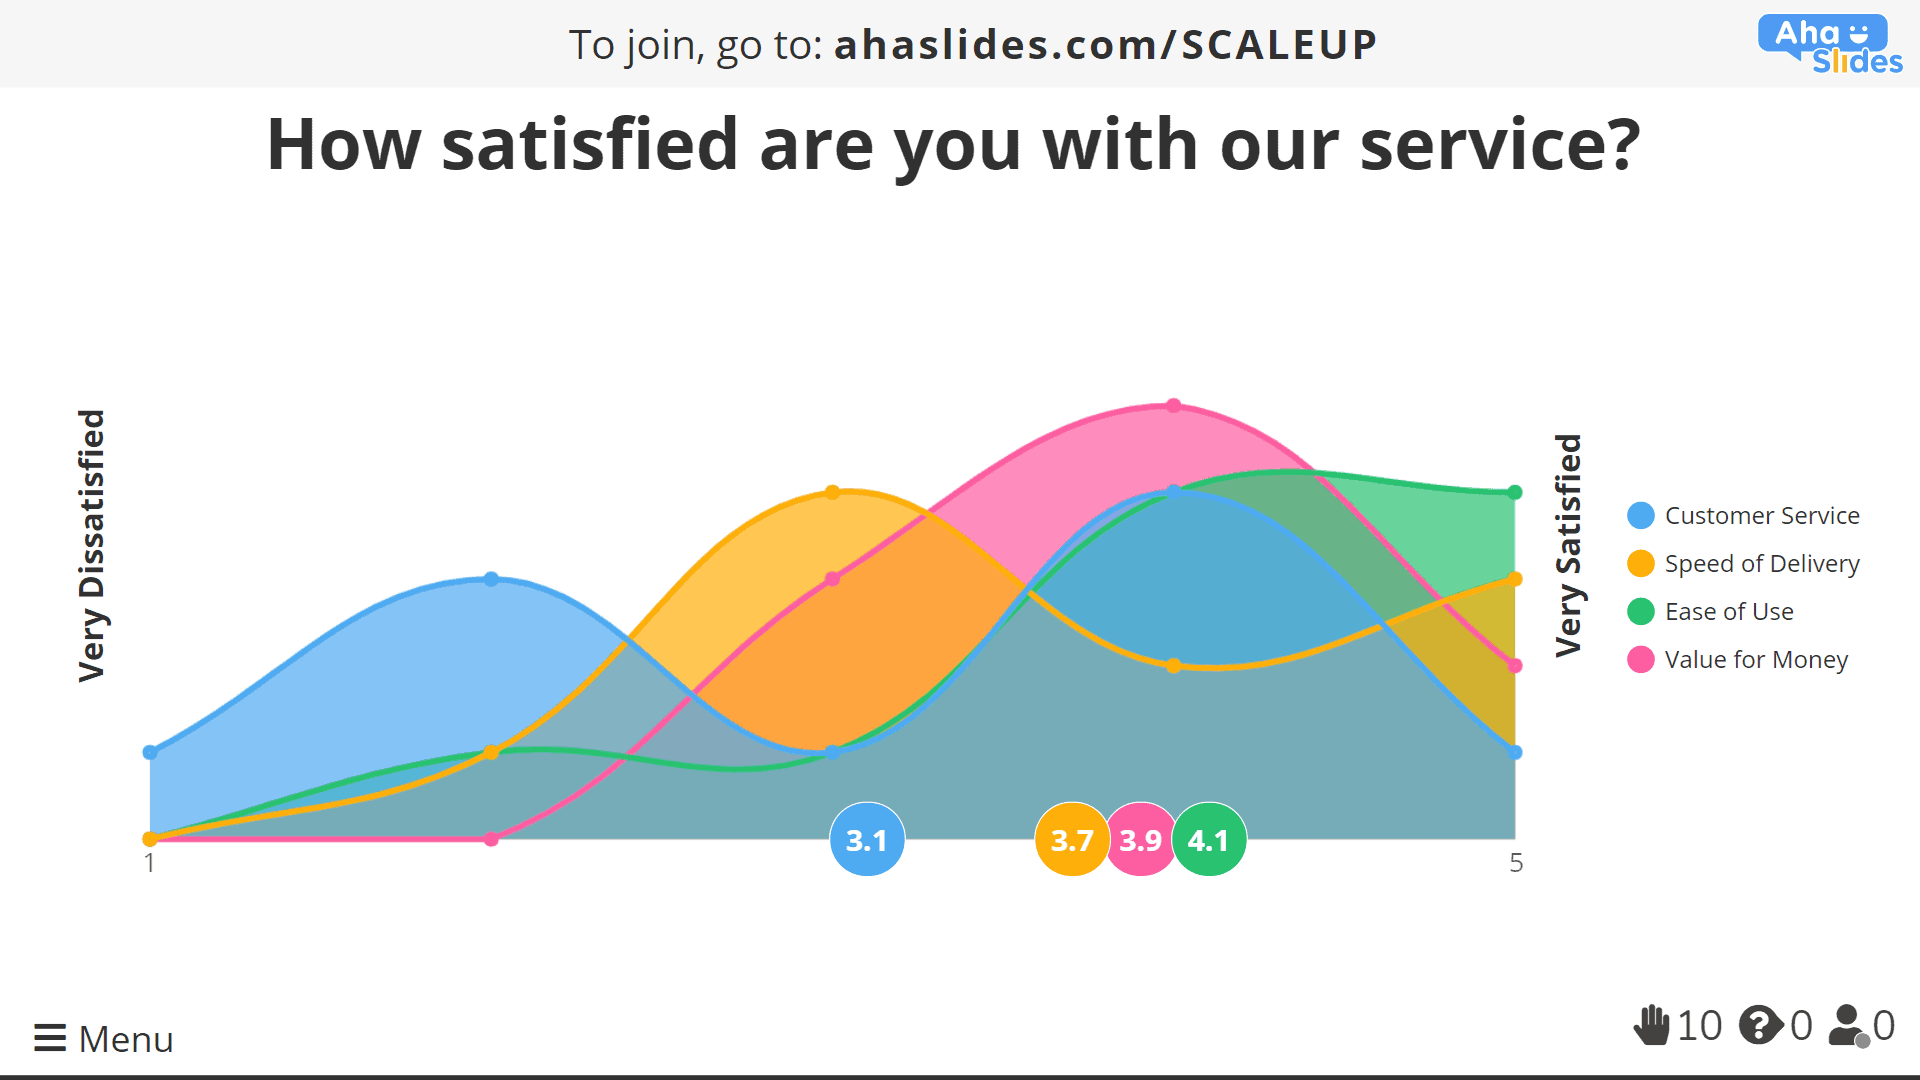
Once you receive response data, it will look something like this:
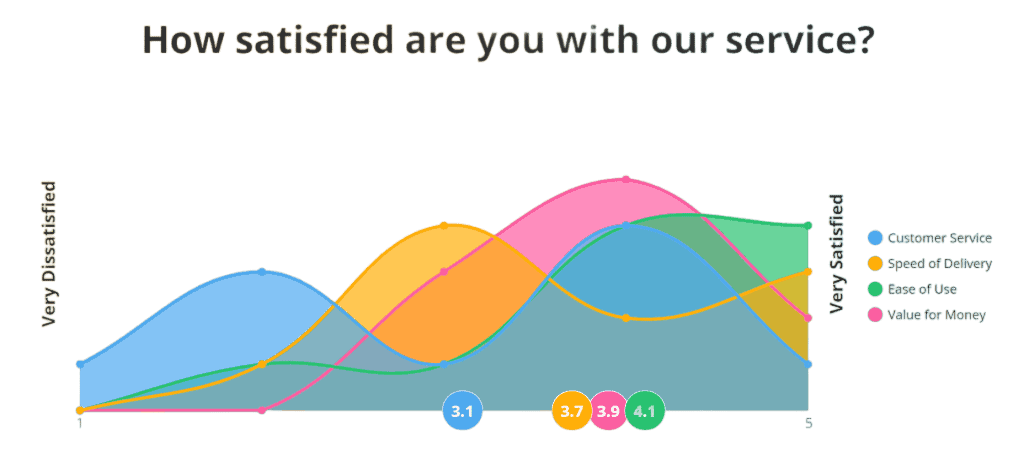
The graph shows all responses across all statements. All the data is colour-coded with your statements so that you see exactly how audience members responded to each statement.
You can see the average performance for each statement in the colour-coded circles at the bottom of the graph. Remember to turn on ‘show the average line for all statements’ in ‘other settings’ to see the average performance of all statements combined, which is displayed in a white circle below the other averages.
If you hover your mouse over each circle, you can see how many responses each value got.
You can also hover your mouse over the statements on the right, or the circle averages at the bottom, to get an isolated view of how each statement fared in the response data.
Related Articles
Using your Google Slides Presentation with AhaSlides
You can embed a Google Slides presentation into AhaSlides. Once embedded, you can present it within AhaSlides. Importing your Google Slides Presentation 1. On your Google Slides presentation, click on File >>> Share >>> Publish to web 2. Click the ...How to Use YouTube Slides on AhaSlides
AhaSlides YouTube Slides let you play YouTube videos on both the presenter and audience screen. Here's how: Choose the Youtube video that you want to play on AhaSlides Copy that YouTube link Paste the link of the Youtube video you want to insert to ...Undo/Redo Function on AhaSlides
AhaSlides now supports an Undo/Redo function that lets you easily reverse or reapply changes made while editing a slide. Whether you've added, updated, or deleted content, you can quickly undo or redo your actions with just a click — helping you work ...How to use/create presentation theme and customize your slides
Your slides don’t just deliver content — they shape how your audience feels, trusts, and engages with your session. With AhaSlides themes, you can make your presentations look polished, consistent, and on-brand in just a few clicks — whether you’re ...Moving and Editing Multiple Slides
You can edit the design and embedded audio of multiple slides at the same time, either with or without Grid View. Editing Slides without Grid View To quickly edit multiple slides, you can simply use the navigation column on the left-side of your ...